In a recent project, we had the need to store data from tens of thousands of IoT devices with at least seven sensors each. We went through a few options, but concluded a pure time series database would be best suited for the job.
Enter InfluxDB. InfluxDB is a time series database written entirely in Go. Influx is meant for exactly this purpose, so it should be a good fit. Its lovely HTTP API lets you connect it to just about anything without the need of additional libraries. Influx is also a ‘schemaless’ database so it’s pretty much just plug n’ play!
Performance
When developing our app in a Vagrant box, InfluxDB seemed fast. We were running it with a simulated set of a years worth of data (7 measurements with about 4,2 million data points each) in each of our developers boxes, and the queries we needed felt fast. But is it fast enough?
We estimated we need to be able to handle writing 3,500 measurements every second with the additional query running every now and then from our app. This would be on a proper hardware, but the testing platform for this is a fit-PC4 Pro with 8Gb of RAM and a Kingston SSD drive.
I was initially going to do the work with Multi-Mechanize as I have used it before, but after checking their repo I noticed it hasn’t been updated in 3 years. After going through a few options, Locust seemed like a choice of the 21st century, with it’s clean and simple way of writing tests (yay Python!).
The purpose was not to get an extensive 50-page performance report, but just to get a quick idea on how does the database we selected perform under real-life-like load.
Setting up
Setting up Locust is dead simple. Just:
pip install locustio |
in a virtualenv or globally, and you’re good to go.
Tests will be run from my laptop, connected directly to the fit-PC via an Ethernet cable, to minimize network latency.
Writing tasks
For querying, I’ll add two tasks for querying data from InfluxDB.
| from locust import HttpLocust, TaskSet, task | |
| class UserBehavior(TaskSet): | |
| def on_start(self): | |
| self.query1 = {“q“: “select * from temperature where (device_id = ‘10001’ or | |
| device_id = ‘10002‘ or device_id = ‘10003‘ or device_id = ‘10004‘ or | |
| device_id = ‘10005‘) and time > now() – 6h“, | |
| “db“: “load_testing“} | |
| self.query2 = {“q“: “select last(value) from /.*/ where time > NOW() – 1m group by *“, | |
| “db“: “load_testing“} | |
| @task(1) | |
| def get_latest_data(self): | |
| self.client.get(“/query“, params=self.query1, | |
| name=“Select 6h of data from temperature for 5 devices“) | |
| @task(1) | |
| def get_latest_data_for_all_devices(self): | |
| self.client.get(“/query“, params=self.query2, | |
| name= “Select last value from all measurements for all devices“) | |
| class WebsiteUser(HttpLocust): | |
| task_set = UserBehavior | |
| min_wait=1000 | |
| max_wait=3000 |
With this, I can just run Locust and point my browser to localhost:8089
$ locust --host=http://<hostname>:8086[2016-02-25 21:04:55,924] lkuittin-mbp/INFO/locust.main: Starting web monitor at *:8089[2016-02-25 21:04:55,925] lkuittin-mbp/INFO/locust.main: Starting Locust 0.7.3 |
For a close-to-production scenario, I want to do about 1 query per 100 writes. This can easily be achieved with task weights. I’ll add two write tasks, one to write just one point, and the other to write 250 points at once, to see how batched writes do compared to single writes. For the second write I generated a file with 250 points of random data.
| @task(100) | |
| def write_one_measurement_for_one_device(self): | |
| self.client.post(“/write“, data=self.datapoint_temperature, | |
| params=“db=load_testing“, | |
| headers={‘Content-Type‘: ‘application/octet-stream‘}, | |
| name=“Write one measurement for one device“) | |
| @task(100) | |
| def write_250_measurements_to_all_series(self): | |
| self.client.post(“/write“, data=datapoints_250, | |
| params=“db=load_testing“, | |
| headers={‘Content-Type‘: ‘application/octet-stream‘}, | |
| name=“Write 250 measurements across 7 series“) |
With these four tasks, I planned the following test cases, testing both single and batch writes:
- Single writes + queries, 10 clients with 1 to 3 second wait
- Single writes + queries, 50 clients with 1 to 3 second wait
- Single writes + queries, 75 clients with 1 to 3 second wait
- Single writes + queries, 100 clients with 1 to 3 second wait
- Single writes + queries, 150 clients with 1 to 3 second wait
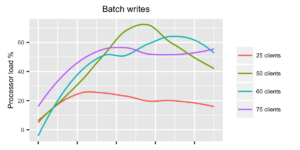
- Batch writes + queries, 25 clients with 1 to 3 second wait
- Batch writes + queries, 50 clients with 1 to 3 second wait
- Batch writes + queries, 60 clients with 1 to 3 second wait
- Batch writes + queries, 75 clients with 1 to 3 second wait
The tests are selected quite arbitrarily, but based on the initial tests I ran on the system. I tried to do reasonable increments in the load to find where the fail would happen, without having to run hundreds of tests.
During testing, I will comment out either the singular or the batch writes, to see how they do compared to one another.
Showtime
Each test was run manually from the Locust UI. During each test I gathered system statistics with sar from the sysstat package.
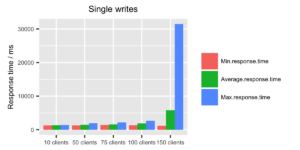
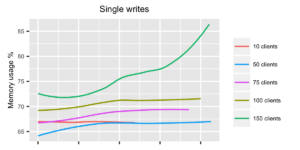
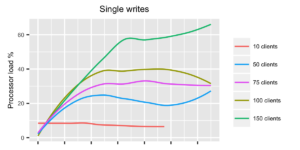
When looking at the response times for single writes, the system seems to be behaving ok up until 100 clients. With 150 clients the response times start getting fairly high, and memory usage is getting close to 90%. So with single writes, a rough estimate would be that InfluxDB can handle approximately 50 points per second.
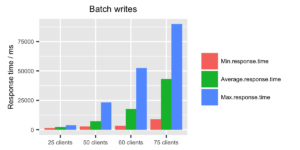
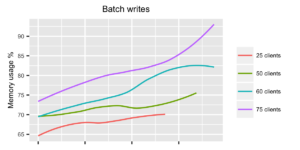
With batch writes, as expected, the story is immediately completely different. Just with 25 clients, we can already reach approximately 3000 points per second, which almost satisfies our requirements. Doubling the load to 50 clients there’s a spike in CPU usage, but the response times are just about okay and the system seems to survive batch writes of 6000 points per second as well. Raising the load to 60 and 75 clients started to bring the system to its knees. I observed a few fails (due to write timeouts), as InfluxDB couldn’t respond fast enough. Running the test with 75 clients even longer would probably have choked the system even more, as memory usage kept climbing the longer the test was running.
Adjusting the batch size, write intervals and amount of clients could possibly get even better results, but for now these results are enough.
Conclusion
We should have no problems with InfluxDB when we get actual production load, as it seems to perform just fine on fairly underpowered hardware. The batched writes work much better (as recommended by InfluxDB documentation), so sticking to them should bring good results.
Locust is an awesome tool for performance testing, and has very nice features for testing web-apps. It’s fairly simple to write your own clients as well, if you need to test something else than HTTP.
It took some trial and error to figure out a reasonable way to use Locust for this purpose. As I used my own laptop to run the tests, it quickly ran into performance issues if the tests were running in too many threads. Also the min_wait and max_wait values needed some tuning, so that a good load is generated on the DB, without any network hiccups or laptop performance issues getting in the way. For example, doubling the 1sec minimun and 3sec maximum values, and doubling the number of locusts easily generates much more timeouts, and it seemed that this was only because the individual threads started to run too slow. For bigger scale testing running Locust in Distributed mode with several slaves would be a much better option, so generating the load doesn’t become the bottleneck.
InfluxDB also seems to be fairly conservative when it comes to disk space usage. After running our tests and spamming the box with these load tests, the database took about 3.3Gb on the disk, with over 110 million datapoints.
Links
All the code, scripts, raw results are available at https://github.com/lauriku/influx_loadtesting